![]()
University of Greater Manchester
Deane Road, Bolton, BL3 5AB.

Back to menu
Back to menu
Study with an Off-Campus Partner
Back to menu
The information published on these pages shows:
The number of students who attained a particular degree or other academic award, or a particular level of such an award, on completion of their course with us.
It shows these numbers by reference to:
Provider: The University of Greater Manchester
UKPRN: 10006841
For details of non-numeric values in the following table, please see the 'Workbook overview' worksheet
Table 1a: Percentage of classified first degrees at grade 2:1 or above by characteristic for 2023-24 and 2024-25 qualifiers.
| Year of qualifying | Characteristics | Characteristic split | Percentage |
|---|---|---|---|
| 2023-24 | Ethnicity | Asian | 68.3 |
| Black | 52.2 | ||
| Mixed | 60.0 | ||
| Other | 79.6 | ||
| White | 75.2 | ||
| English IMD 2025 quintile | 1 | 61.1 | |
| 2 | 71.7 | ||
| 3 | 71.7 | ||
| 4 | 78.1 | ||
| 5 | 83.0 | ||
| Sex | Female | 69.1 | |
| Male | 70.1 | ||
| 2024-25 | Ethnicity | Asian | 72.7 |
| Black | 57.5 | ||
| Mixed | 78.4 | ||
| Other | 56.8 | ||
| White | 76.7 | ||
| English IMD 2025 quintile | 1 | 66.3 | |
| 2 | 68.0 | ||
| 3 | 77.7 | ||
| 4 | 80.2 | ||
| 5 | 80.8 | ||
| Sex | Female | 73.4 | |
| Male | 66.6 |
Provider name: University of Greater Manchester
UKPRN: 10006841
For details of non-numeric values in the following table, please see the 'Workbook overview' worksheet
Table 1b: Detailed information on attainment for 2023-24 and 2024-25 qualifiers.
| Academic year of qualifying | Mode of Study | Characteristic | Characteristic split | Headcount of classified First Degrees awarded | Percentage of classified First Degrees awarded as first class | Percentage of classified First Degrees awarded as upper second class | Percentage of classified First Degrees awarded as lower second class | Percentage of classified First Degrees awarded as third class / pass | Headcount of unclassified First Degrees awarded | Headcount of other undergraduate awards |
|---|---|---|---|---|---|---|---|---|---|---|
| 2023-24 | Full-time | Ethnicity | Asian | 160 | 21.3 | 47.5 | 22.5 | 8.8 | [low] | 20 |
| Black | 270 | 8.2 | 43.7 | 36.9 | 11.2 | [low] | 50 | |||
| Mixed | 40 | 23.1 | 38.5 | 30.8 | 7.7 | [none] | [low] | |||
| Other | 50 | 17.0 | 61.7 | 19.1 | [DPL] | [none] | [low] | |||
| White | 960 | 24.7 | 49.9 | 21.8 | 3.6 | 30 | 180 | |||
| Unknown | 150 | 20.0 | 37.9 | 31.7 | 10.3 | [low] | 110 | |||
| EIMD 2025 quintile | 1 | 650 | 19.5 | 40.9 | 30.2 | 9.3 | 20 | 160 | ||
| 2 | 380 | 20.3 | 51.2 | 23.7 | 4.7 | [low] | 100 | |||
| 3 | 270 | 17.1 | 52.8 | 26.0 | 4.1 | [low] | 60 | |||
| 4 | 190 | 24.3 | 54.0 | 18.0 | 3.7 | [low] | 50 | |||
| 5 | 110 | 31.0 | 51.3 | 15.9 | [DPL] | [low] | 40 | |||
| N/A | [low] | [low] | [low] | [low] | [low] | [none] | [low] | |||
| Unknown | [none] | [none] | [none] | [none] | [none] | [none] | [none] | |||
| Sex | Female | 1080 | 20.2 | 48.2 | 26.1 | 5.4 | 30 | 260 | ||
| Male | 530 | 22.5 | 46.3 | 23.8 | 7.4 | 30 | 140 | |||
| Unknown | [low] | [low] | [low] | [low] | [low] | [none] | [none] | |||
| Part-time | Ethnicity | Asian | [low] | [low] | [low] | [low] | [low] | [none] | [low] | |
| Black | [none] | [none] | [none] | [none] | [none] | [none] | [low] | |||
| Mixed | [none] | [none] | [none] | [none] | [none] | [none] | [low] | |||
| Other | [none] | [none] | [none] | [none] | [none] | [none] | [none] | |||
| White | 30 | 38.7 | 35.5 | 22.6 | [DPL] | [none] | 110 | |||
| Unknown | [none] | [none] | [none] | [none] | [none] | [none] | 30 | |||
| EIMD 2025 quintile | 1 | [low] | [low] | [low] | [low] | [low] | [low] | 40 | ||
| 2 | [low] | [low] | [low] | [low] | [low] | [none] | 40 | |||
| 3 | [low] | [low] | [low] | [low] | [low] | [none] | 20 | |||
| 4 | [low] | [low] | [low] | [low] | [low] | [none] | 30 | |||
| 5 | [low] | [low] | [low] | [low] | [low] | [none] | 40 | |||
| N/A | [low] | [low] | [low] | [low] | [low] | [none] | [low] | |||
| Unknown | [none] | [none] | [none] | [none] | [none] | [none] | [none] | |||
| Sex | Female | 30 | 32.1 | 39.3 | 21.4 | [DPL] | [low] | 140 | ||
| Male | [low] | [low] | [low] | [low] | [low] | [none] | 30 | |||
| Unknown | [none] | [none] | [none] | [none] | [none] | [none] | [none] | |||
| Apprenticeships | Ethnicity | Asian | [low] | [low] | [low] | [low] | [low] | [none] | [low] | |
| Black | [none] | [none] | [none] | [none] | [none] | [none] | [low] | |||
| Mixed | [none] | [none] | [none] | [none] | [none] | [none] | [low] | |||
| Other | [none] | [none] | [none] | [none] | [none] | [none] | [none] | |||
| White | 120 | 43.8 | 36.4 | 18.2 | [DPL] | [none] | 100 | |||
| Unknown | [none] | [none] | [none] | [none] | [none] | [none] | [low] | |||
| EIMD 2025 quintile | 1 | 30 | 31.3 | 40.6 | 28.1 | [DPL] | [none] | 40 | ||
| 2 | 30 | 38.5 | 34.6 | 23.1 | [DPL] | [none] | 30 | |||
| 3 | 30 | 48.5 | 36.4 | 15.2 | [DPL] | [none] | [low] | |||
| 4 | [low] | [low] | [low] | [low] | [low] | [none] | [low] | |||
| 5 | [low] | [low] | [low] | [low] | [low] | [none] | [low] | |||
| N/A | [none] | [none] | [none] | [none] | [none] | [none] | [none] | |||
| Unknown | [none] | [none] | [none] | [none] | [none] | [none] | [none] | |||
| Sex | Female | 90 | 34.1 | 41.8 | 22.0 | [DPL] | [none] | 110 | ||
| Male | 40 | 59.0 | 25.6 | 15.4 | [DPL] | [none] | [low] | |||
| Unknown | [none] | [none] | [none] | [none] | [none] | [none] | [none] | |||
| 2024-25 | Full-time | Ethnicity | Asian | 210 | 31.3 | 39.9 | 23.6 | 5.3 | [low] | 50 |
| Black | 290 | 20.5 | 36.3 | 34.9 | 8.2 | [low] | 80 | |||
| Mixed | 50 | 33.3 | 45.8 | 14.6 | 6.3 | [low] | [low] | |||
| Other | 40 | 16.7 | 41.7 | 38.9 | [DPL] | [none] | [low] | |||
| White | 950 | 30.7 | 42.6 | 23.9 | 2.8 | 30 | 160 | |||
| Unknown | 110 | 11.0 | 38.5 | 45.9 | 4.6 | [low] | 120 | |||
| EIMD 2025 quintile | 1 | 680 | 28.7 | 35.1 | 30.0 | 6.1 | 30 | 210 | ||
| 2 | 380 | 23.2 | 40.9 | 32.3 | 3.6 | [low] | 100 | |||
| 3 | 250 | 24.0 | 53.3 | 20.3 | 2.4 | [low] | 60 | |||
| 4 | 180 | 27.0 | 50.0 | 20.2 | 2.8 | [low] | 40 | |||
| 5 | 140 | 39.6 | 37.4 | 20.9 | 2.2 | [low] | 30 | |||
| N/A | [low] | [low] | [low] | [low] | [low] | [none] | [low] | |||
| Unknown | [none] | [none] | [none] | [none] | [none] | [none] | [none] | |||
| Sex | Female | 1140 | 30.8 | 40.1 | 24.6 | 4.4 | 40 | 310 | ||
| Male | 510 | 19.8 | 42.7 | 33.3 | 4.1 | 30 | 130 | |||
| Unknown | [none] | [none] | [none] | [none] | [none] | [none] | [none] | |||
| Part-time | Ethnicity | Asian | [low] | [low] | [low] | [low] | [low] | [none] | [low] | |
| Black | [none] | [none] | [none] | [none] | [none] | [none] | [low] | |||
| Mixed | [none] | [none] | [none] | [none] | [none] | [none] | [none] | |||
| Other | [none] | [none] | [none] | [none] | [none] | [none] | [none] | |||
| White | 30 | 38.5 | 46.2 | 15.4 | [DPL] | [none] | 100 | |||
| Unknown | [none] | [none] | [none] | [none] | [none] | [none] | [low] | |||
| EIMD 2025 quintile | 1 | [low] | [low] | [low] | [low] | [low] | [none] | 40 | ||
| 2 | [low] | [low] | [low] | [low] | [low] | [none] | [low] | |||
| 3 | [low] | [low] | [low] | [low] | [low] | [none] | [low] | |||
| 4 | [low] | [low] | [low] | [low] | [low] | [none] | 20 | |||
| 5 | [none] | [none] | [none] | [none] | [none] | [none] | 20 | |||
| N/A | [none] | [none] | [none] | [none] | [none] | [none] | [none] | |||
| Unknown | [none] | [none] | [none] | [none] | [none] | [none] | [none] | |||
| Sex | Female | [low] | [low] | [low] | [low] | [low] | [none] | 90 | ||
| Male | [low] | [low] | [low] | [low] | [low] | [none] | 30 | |||
| Unknown | [none] | [none] | [none] | [none] | [none] | [none] | [none] | |||
| Apprenticeships | Ethnicity | Asian | [low] | [low] | [low] | [low] | [low] | [none] | [low] | |
| Black | [low] | [low] | [low] | [low] | [low] | [none] | [low] | |||
| Mixed | [none] | [none] | [none] | [none] | [none] | [none] | [low] | |||
| Other | [none] | [none] | [none] | [none] | [none] | [none] | [none] | |||
| White | 210 | 59.5 | 32.2 | 7.8 | [DPL] | [none] | 140 | |||
| Unknown | [none] | [none] | [none] | [none] | [none] | [none] | [low] | |||
| EIMD 2025 quintile | 1 | 70 | 55.4 | 32.4 | 10.8 | [DPL] | [none] | 80 | ||
| 2 | 50 | 59.6 | 40.4 | [DPL] | [DPL] | [none] | 40 | |||
| 3 | 40 | 54.3 | 25.7 | 20.0 | [DPL] | [none] | 30 | |||
| 4 | 50 | 61.7 | 27.7 | 10.6 | [DPL] | [none] | 30 | |||
| 5 | 30 | 69.2 | 30.8 | [DPL] | [DPL] | [none] | [low] | |||
| N/A | [none] | [none] | [none] | [none] | [none] | [none] | [none] | |||
| Unknown | [none] | [none] | [none] | [none] | [none] | [none] | [none] | |||
| Sex | Female | 150 | 64.7 | 25.5 | 9.2 | [DPL] | [none] | 170 | ||
| Male | 80 | 47.4 | 44.7 | 7.9 | [DPL] | [low] | 30 | |||
| Unknown | [none] | [none] | [none] | [none] | [none] | [none] | [none] |
This workbook contains data tables relating to the attainment of 2023-24 and 2024-25 qualifiers.
The following worksheets are included in this workbook:
Table 1a Attainment 2023-25 - This worksheet contains table 1a which relates to attainment at the provider. This table presents the percentage of classified first degrees at grade 2:1 or above by characteristics for 2023-24 and 2024-25 qualifiers.
Table 1b Attainment 2023-25 - This worksheet contains table 1b which relates to attainment at the provider. This table presents detailed information on attainment by characteristics for 2023-24 and 2024-25 qualifiers.
The data has been rounded as follows:
a. Denominators or headcounts have been rounded to the nearest 10.
b. Percentages been rounded to the nearest 0.1.
Any data point that is not reportable will be replaced with a symbol to indicate why, applied according to the following hierarchical order:
For more information on the Transparency information 2026, please see the specification and publication guidance document available from the OfS website at: https://www.officeforstudents.org.uk/publications/transparency-information
Provider: The University of Greater Manchester
UKPRN: 10006841
For details of non-numeric values in the following tables, please see the 'Rounding and suppression' worksheet
Ethnic minorities includes students with Asian, Black, Mixed or Other ethnicities, a further breakdown of which is shown in Table 1b.
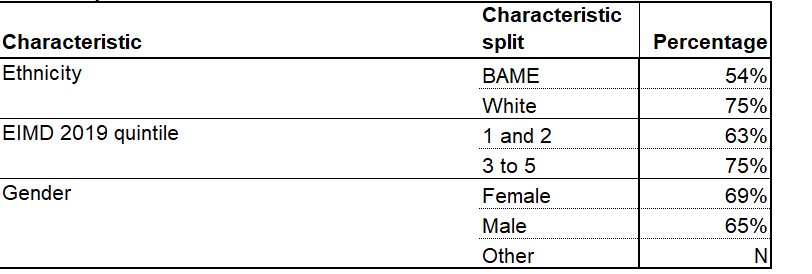
Table 1a: Percentage of classified first degrees at grade 2:1 or above by characteristic for 2021-22 qualifiers.
| Characteristic | Characteristic split | Percentage |
|---|---|---|
| Ethnicity | Ethnic minorities | 55% |
| White | 80% | |
| EIMD 2019 quintile | 1 and 2 | 65% |
| 3 to 5 | 82% | |
| Sex | Female | 71% |
| Male | 69% | |
| Other | N |
Provider: The University of Greater Manchester
UKPRN: 10006841
For details of non-numeric values in the following tables, please see the 'Rounding and suppression' worksheet
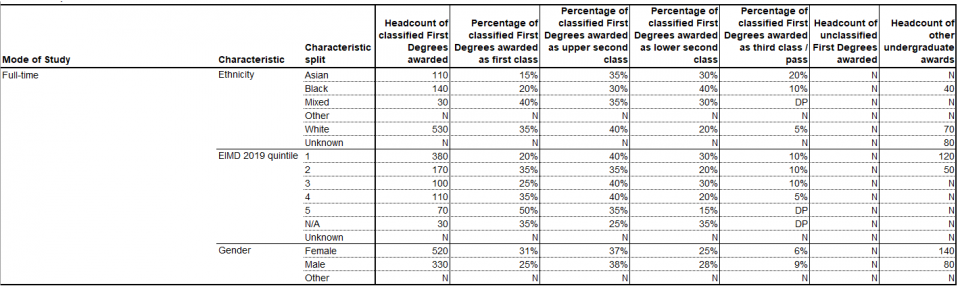
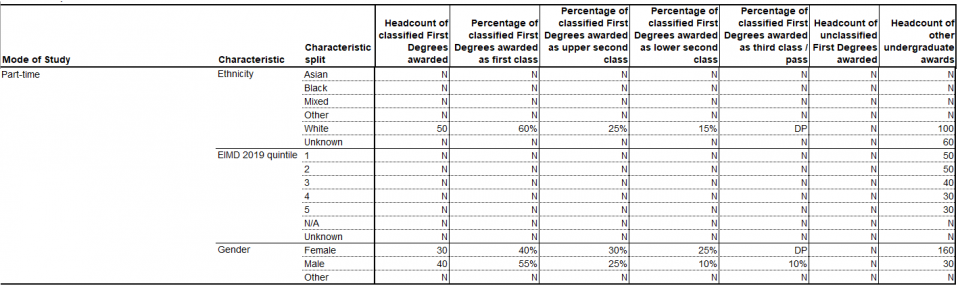
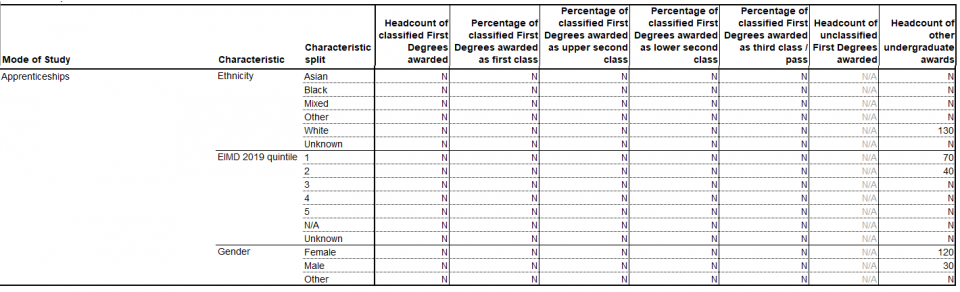
Table 1b: Detailed information on attainment for 2021-22 qualifiers.
| Mode of Study | Characteristic | Characteristic split | Headcount of classified First Degrees awarded | Percentage of classified First Degrees awarded as first class | Percentage of classified First Degrees awarded as upper second class | Percentage of classified First Degrees awarded as lower second class | Percentage of classified First Degrees awarded as third class / pass | Headcount of unclassified First Degrees awarded | Headcount of other undergraduate awards |
|---|---|---|---|---|---|---|---|---|---|
| Full-time | Ethnicity | Asian | 110 | 25% | 35% | 30% | 10% | N | 30 |
| Black | 170 | 10% | 35% | 40% | 15% | N | 40 | ||
| Mixed | 30 | 30% | 45% | 20% | DP | N | N | ||
| White | 520 | 35% | 45% | 20% | 5% | N | 120 | ||
| Other | N | N | N | N | N | N | N | ||
| Unknown | N | N | N | N | N | N | 100 | ||
| EIMD 2019 quintile | 1 | 460 | 21% | 41% | 30% | 8% | N | 160 | |
| 2 | 150 | 28% | 45% | 21% | 6% | N | 50 | ||
| 3 | 80 | 33% | 41% | 20% | 6% | N | 30 | ||
| 4 | 90 | 40% | 40% | 17% | 3% | N | 30 | ||
| 5 | 70 | 40% | 49% | 11% | DP | N | N | ||
| N/A | N | N | N | N | N | N | N | ||
| Unknown | N | N | N | N | N | N | N | ||
| Sex | Female | 570 | 26% | 44% | 25% | 5% | N | 170 | |
| Male | 290 | 29% | 38% | 24% | 9% | N | 120 | ||
| Other | N | N | N | N | N | N | N | ||
| Part-time | Ethnicity | Asian | N | N | N | N | N | N | N |
| Black | N | N | N | N | N | N | N | ||
| Mixed | N | N | N | N | N | N | N | ||
| White | 40 | 45% | 40% | 15% | DP | N | 170 | ||
| Other | N | N | N | N | N | N | N | ||
| Unknown | N | N | N | N | N | N | N | ||
| EIMD 2019 quintile | 1 | N | N | N | N | N | N | 50 | |
| 2 | N | N | N | N | N | N | 50 | ||
| 3 | N | N | N | N | N | N | 40 | ||
| 4 | N | N | N | N | N | N | 30 | ||
| 5 | N | N | N | N | N | N | 30 | ||
| N/A | N | N | N | N | N | N | N | ||
| Unknown | N | N | N | N | N | N | N | ||
| Sex | Female | 30 | 50% | 25% | 20% | DP | N | 160 | |
| Male | N | N | N | N | N | N | 40 | ||
| Other | N | N | N | N | N | N | N | ||
| Apprenticeships | Ethnicity | Asian | N | N | N | N | N | N/A | N |
| Black | N | N | N | N | N | N/A | N | ||
| Mixed | N | N | N | N | N | N/A | N | ||
| White | 30 | 75% | 25% | DP | DP | N/A | 40 | ||
| Other | N | N | N | N | N | N/A | N | ||
| Unknown | N | N | N | N | N | N/A | N | ||
| EIMD 2019 quintile | 1 | N | N | N | N | N | N/A | 30 | |
| 2 | N | N | N | N | N | N/A | N | ||
| 3 | N | N | N | N | N | N/A | N | ||
| 4 | N | N | N | N | N | N/A | N | ||
| 5 | N | N | N | N | N | N/A | N | ||
| N/A | N | N | N | N | N | N | N | ||
| Unknown | N | N | N | N | N | N/A | N | ||
| Sex | Female | N | N | N | N | N | N/A | 40 | |
| Male | N | N | N | N | N | N/A | N | ||
| Other | N | N | N | N | N | N/A | N |
The data contained in the tables in this workbook have been rounded and suppressed as follows:
Numerators and denominators have been rounded to the nearest 10. Where the numerator or denominator rounds to 20 or less, the data are suppressed with an "N".
Percentages are rounded according to the smallest, unsuppressed denominator in a given mode and characteristic. If the denominator rounds to:
- 50 or less: percentages are rounded to 5%
- 1000 or less: percentages are rounded to 1%
- More than 1000: percentages are rounded to 0.1%
"N/A" is displayed where there is no provision in a given mode or level
"DP" indicates suppression for data protection reasons. This is applied where the numerator is two or less, or differs from the denominator by no more than two students.
Provider: The University of Greater Manchester
UKPRN: 10006841
For details of non-numeric values in the following tables, please see the 'Rounding and suppression' worksheet
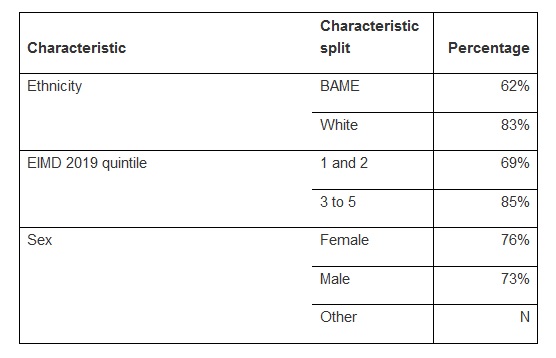
Table 1a: Percentage of classified first degrees at grade 2:1 or above by characteristic for 2020-21 qualifiers.
Provider: The University of Greater Manchester
UKPRN: 10006841
For details of non-numeric values in the following tables, please see the 'Rounding and suppression' worksheet
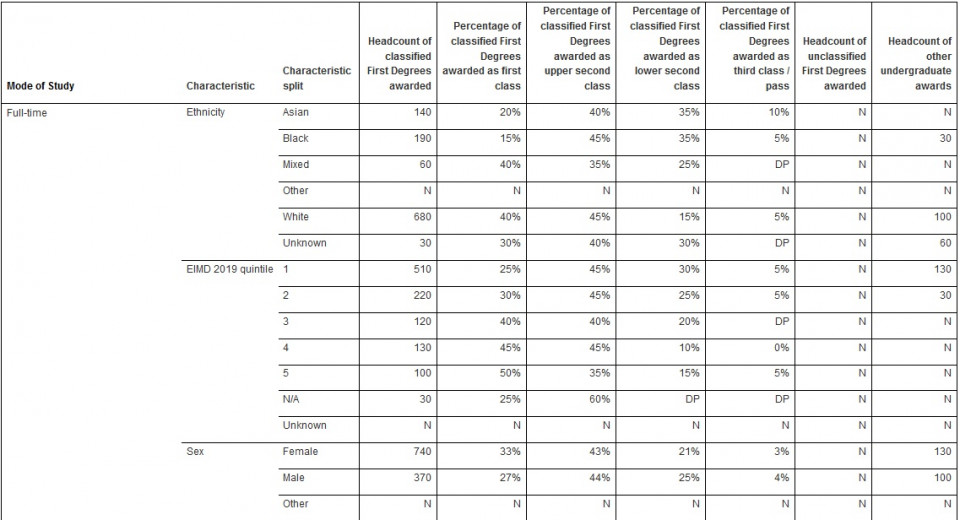
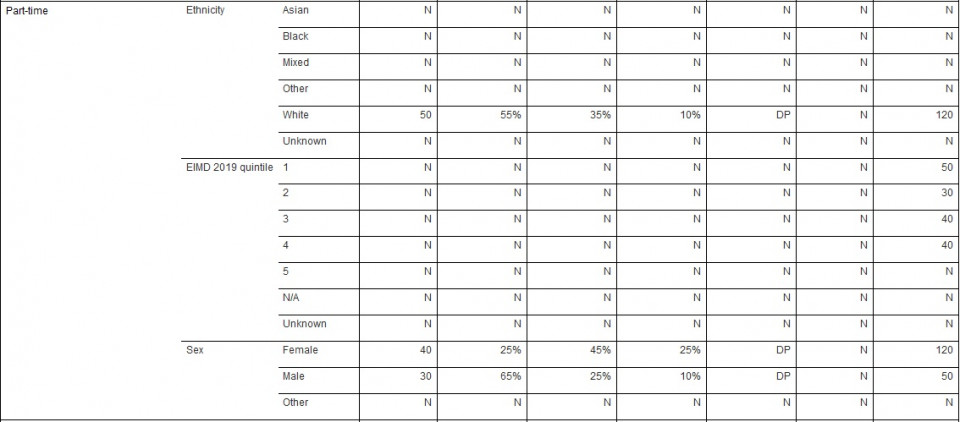
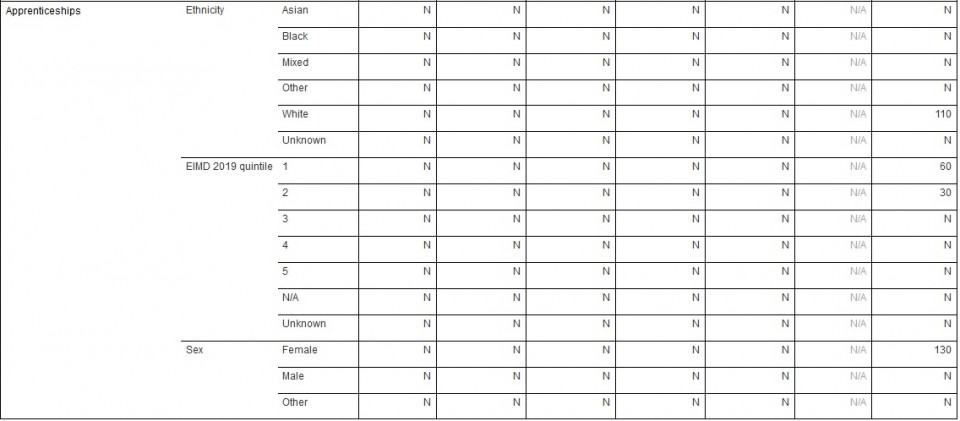
Table 1b: Detailed information on attainment for 2020-21 qualifiers.
The data contained in the tables in this workbook have been rounded and suppressed as follows:
Numerators and denominators have been rounded to the nearest 10. Where the numerator or denominator rounds to 20 or less, the data are suppressed with an "N".
Percentages are rounded according to the smallest, unsuppressed denominator in a given mode and characteristic. If the denominator rounds to:
- 50 or less: percentages are rounded to 5%
- 1000 or less: percentages are rounded to 1%
- More than 1000: percentages are rounded to 0.1%
"N/A" is displayed where there is no provision in a given mode or level
"DP" indicates suppression for data protection reasons. This is applied where the numerator is two or less, or differs from the denominator by no more than two students.
Provider: The University of Greater Manchester
UKPRN: 10006841
For details of non-numeric values in the following tables, please see the 'Rounding and suppression' worksheet
Table 1a: Percentage of classified first degrees at grade 2:1 or above by characteristic for 2019-20 qualifiers.
Provider: The University of Greater Manchester
UKPRN: 10006841
For details of non-numeric values in the following tables, please see the 'Rounding and suppression' worksheet
Table 1b: Detailed information on attainment for 2019-20 qualifiers.
The data contained in the tables in this workbook have been rounded and suppressed as follows:
Numerators and denominators have been rounded to the nearest 10. Where the numerator or denominator rounds to 20 or less, the data are suppressed with an "N".
Percentages are rounded according to the smallest, unsuppressed denominator in a given mode and characteristic. If the denominator rounds to:
"N/A" is displayed where there is no provision in a given mode or level
"DP" indicates suppression for data protection reasons. This is applied where the numerator is two or less, or differs from the denominator by no more than two students.
Download the app for your smartphone from: